Logistics & Industrial

Existing CCTV, read continuously. The metrics ops teams already build SLAs around — finally measured.

Trailer dwell at the dock, congestion in the aisles, yard utilisation by hour. Canopy connects to the cameras your operations centre already monitors and surfaces the intelligence your team already needs.

Request a logistics demo

Live signals — logistics hub

38 min Dock 4 dwell (avg)
79% Yard utilisation
3 Aisle congestion alerts
94% On-time departure rate
06:00–08:00 Peak arrival window

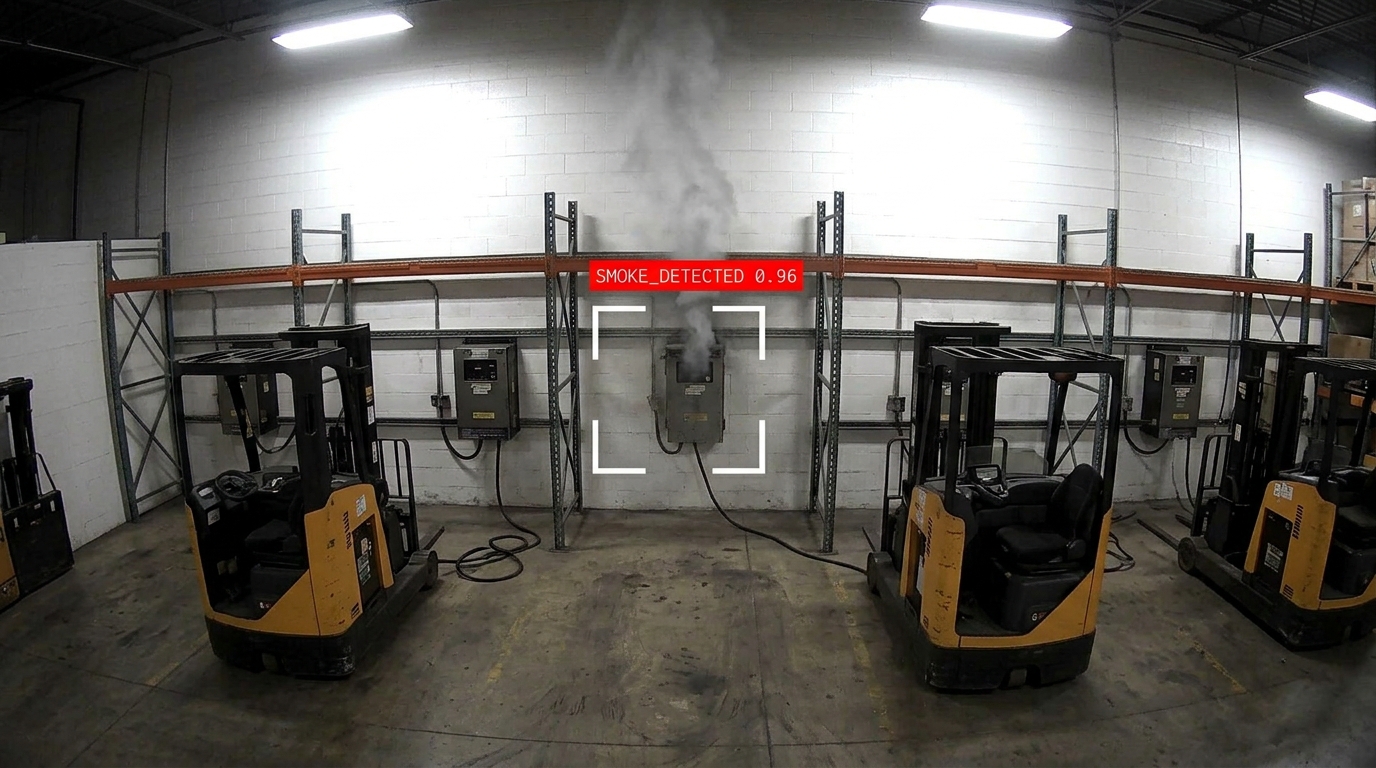
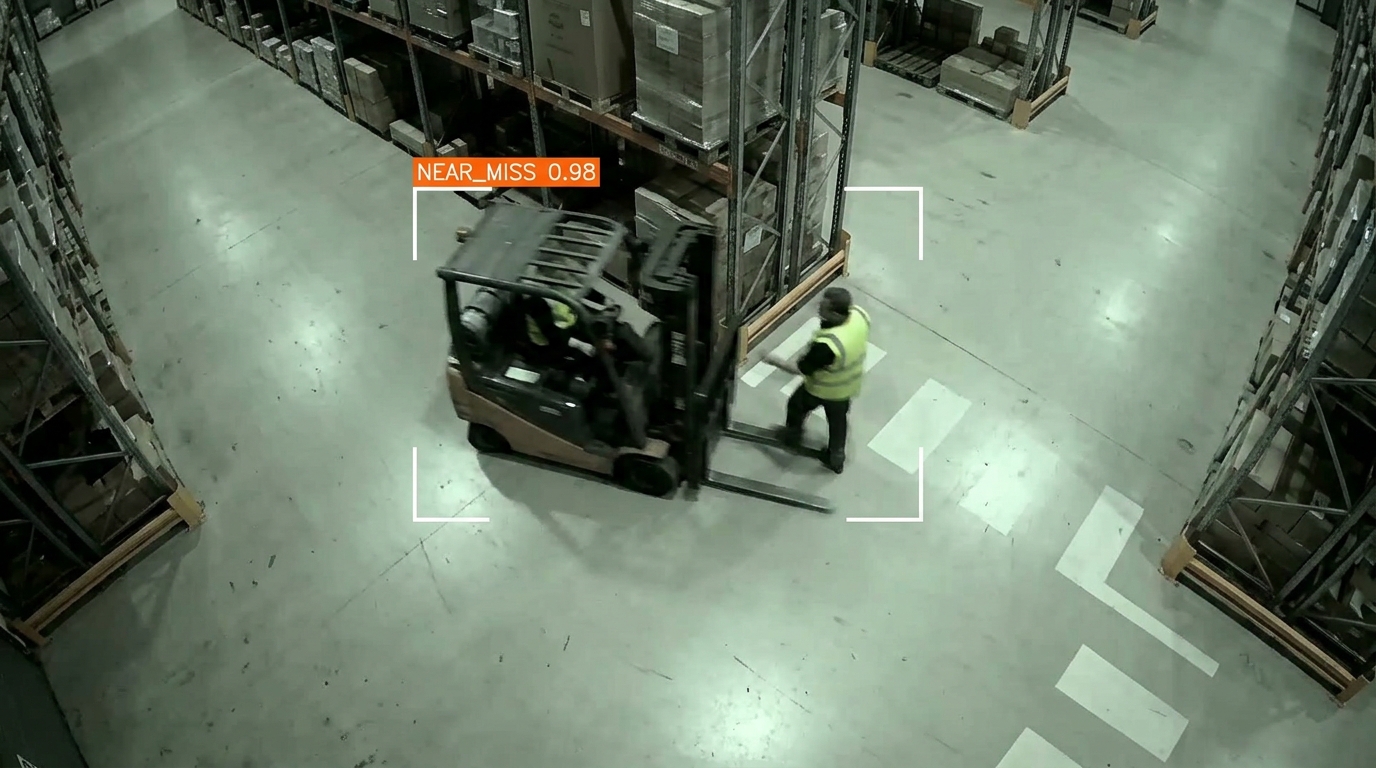
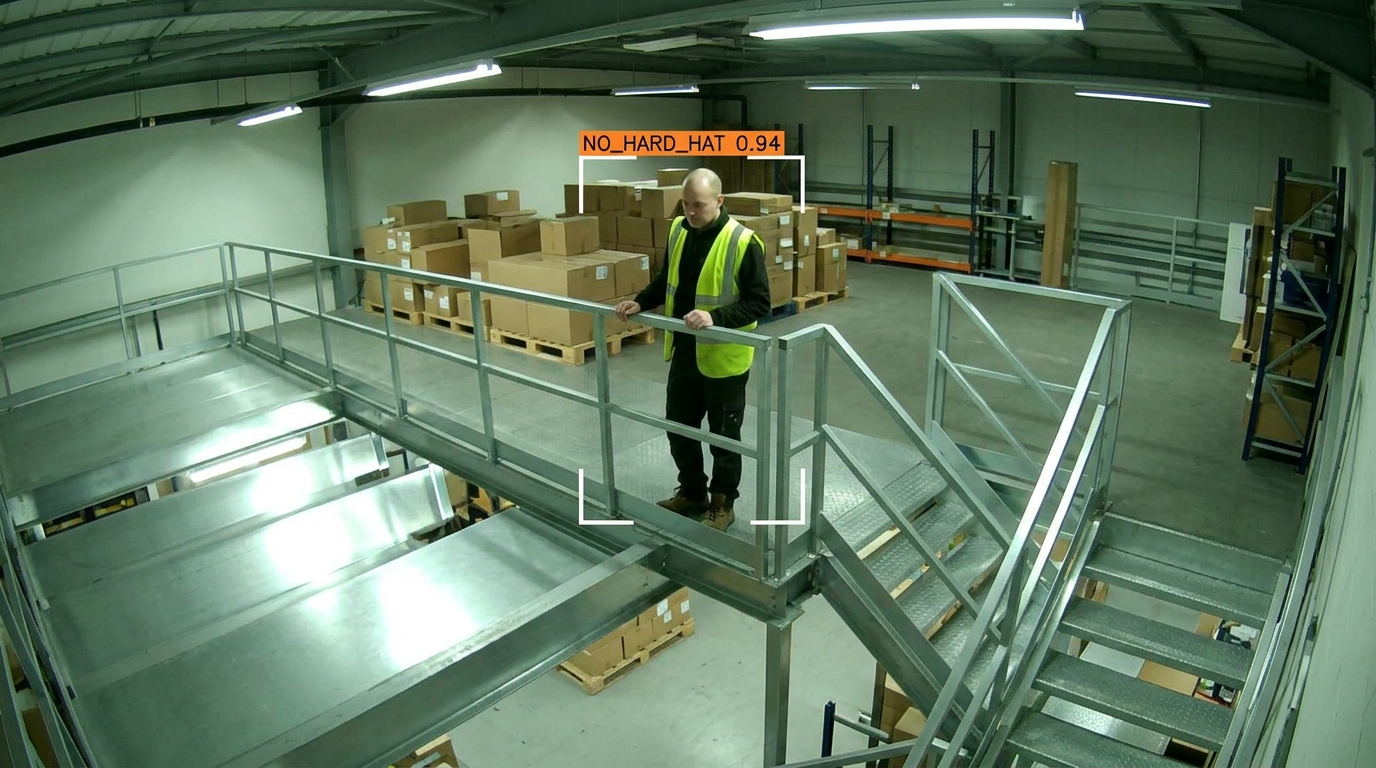
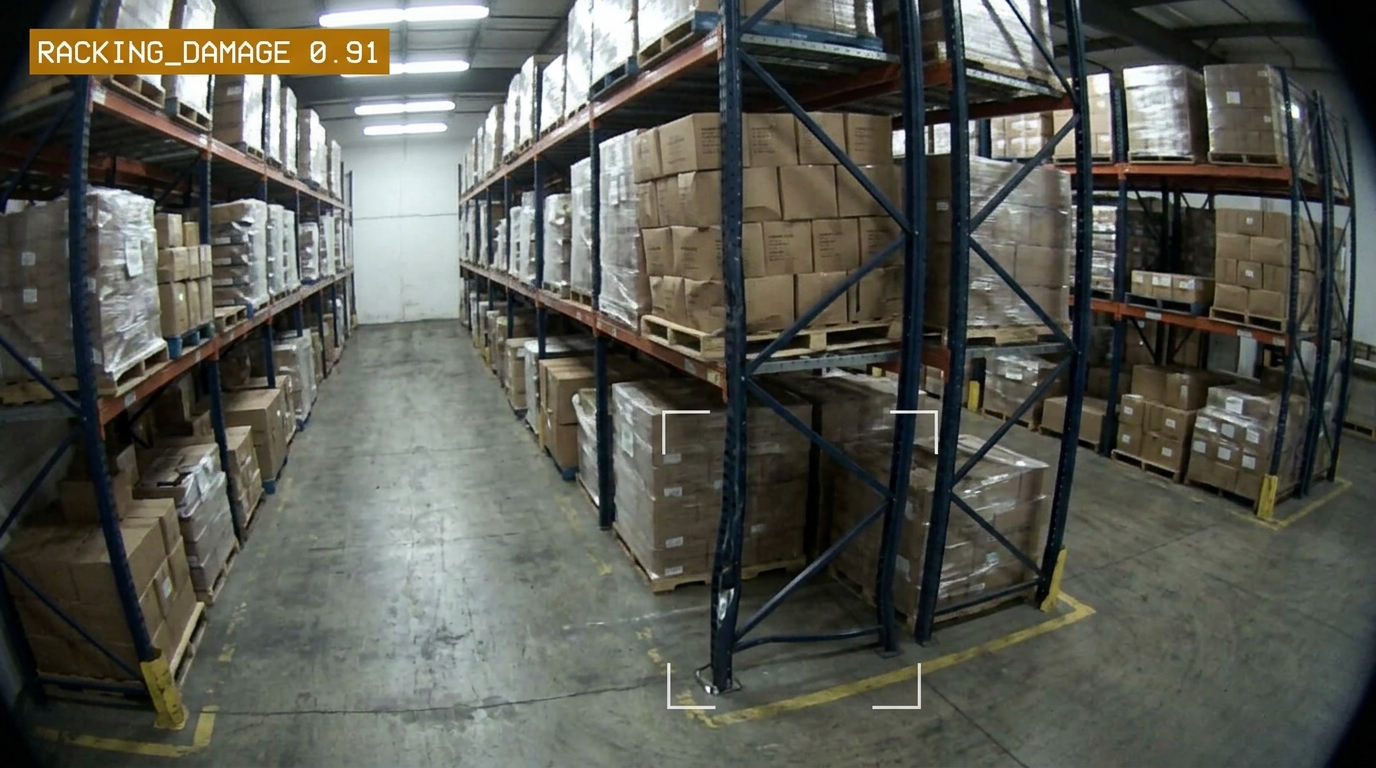
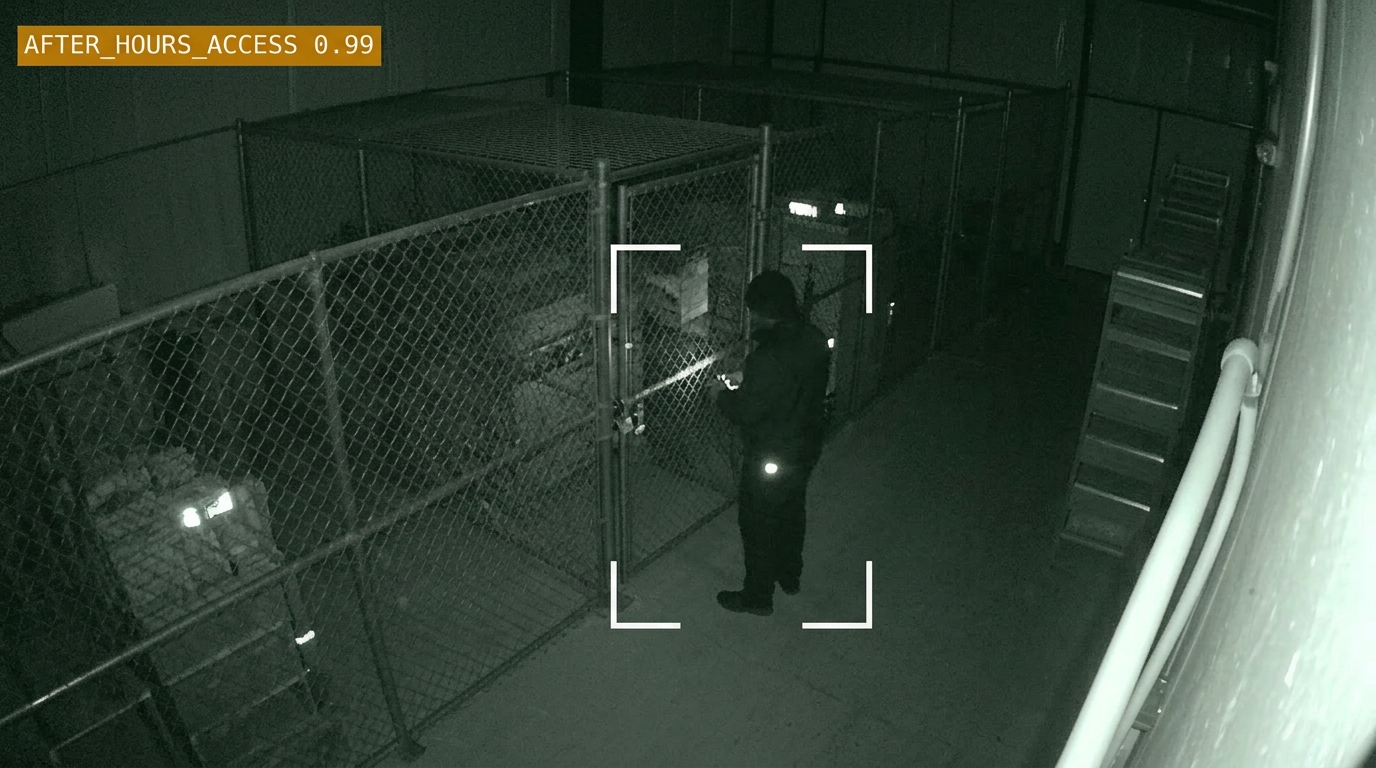
Safety & Loss Prevention

The fastest path to budget — because it maps directly to insurance, liability, and regulatory exposure.

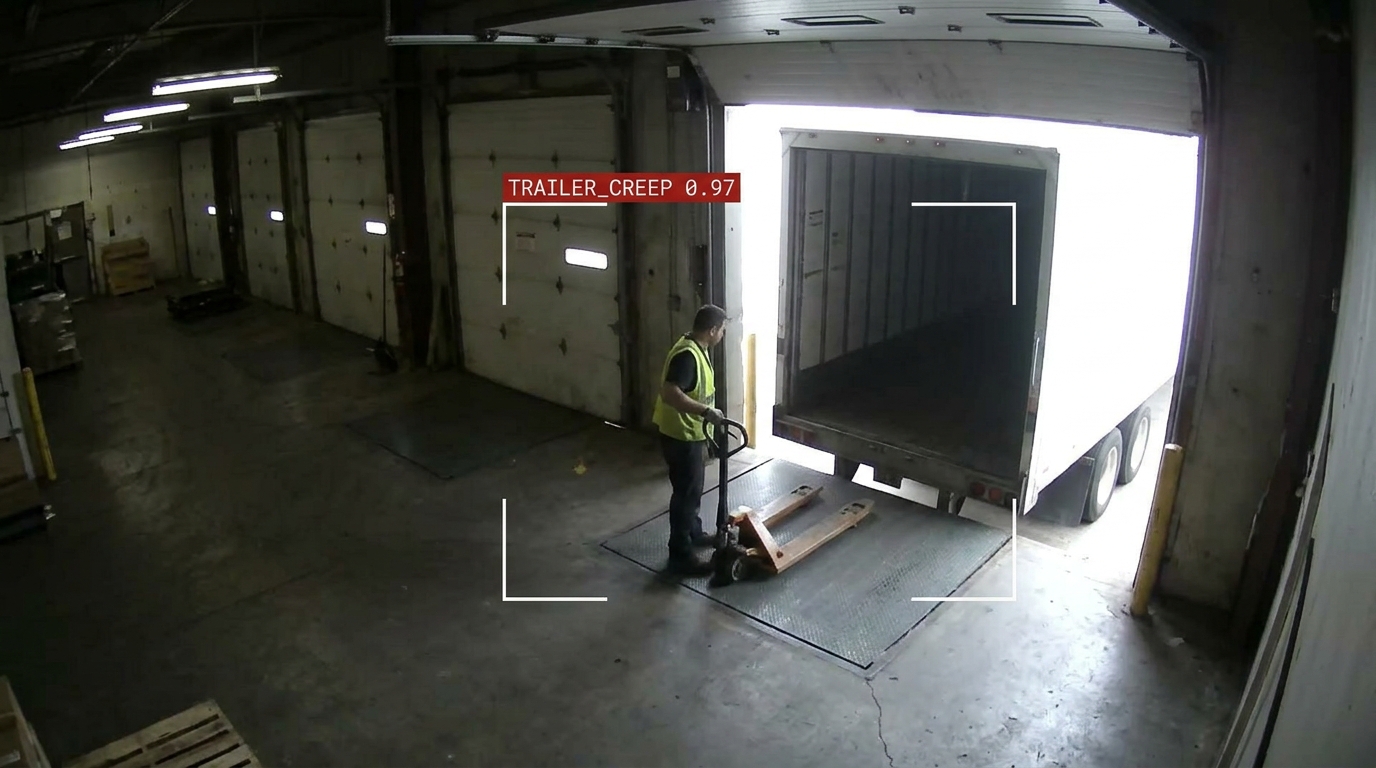
Every use case below is detectable from cameras already on-site. No new hardware. Live from day one.

CAM_047 · Charging Bay · Aisle D 06:14:22

01

Fire & Hazard Detection

  • Early smoke & flame in racking aisles
  • Battery / forklift charging bay overheating
  • Blocked fire exits & fire lane encroachment
  • Flammables stored outside designated zones
Critical risk
CAM_112 · Zone B 14:31:07

02

Forklift & Pedestrian

  • Near-miss detection — #1 warehouse fatality cause
  • Forklift speeding in shared zones
  • Blind-corner & counter-flow conflicts
High risk
CAM_089 · Mezzanine 09:55:41

03

PPE & Compliance

  • Hi-vis, hard hat & footwear by zone
  • Working at height without harness
  • Repeat offender pattern escalation
High risk
CAM_203 · Bay 7C 11:08:53

04

Racking & Load Integrity

  • Damaged uprights after forklift impact
  • Overhanging or improperly stacked pallets
  • Loads beyond rated bay capacity
Moderate risk
CAM_031 · Dock 3 07:42:19

05

Dock & Loading Safety

  • Trailer creep while still being loaded
  • Person in dock gap or under leveller
  • Yard vehicles moving near pedestrians
Critical risk
CAM_178 · High-Value Storage · Bay A 02:14:08

06

Loss Prevention & Shrinkage

  • Unauthorised after-hours access detection
  • Loitering or unusual dwell near high-value SKUs
  • Tampering with goods & mis-pick detection
  • Inventory loss mapped to camera events
Moderate risk

Operational efficiency

Four intelligence layers that sell the renewal.

01

Dock dwell & throughput

Trailer arrival, docking, and departure timestamps per bay. Average dwell time by dock, by shift, and by carrier. Demurrage risk flagged in real time before it becomes a charge.

Dock performance · Shift A
Dock 122 min avg · 98% on time
Dock 231 min avg · 91% on time
Dock 344 min avg · 76% on time
Dock 438 min avg · 83% on time
02

Yard utilisation

Slot occupancy by hour across the full yard. Peak utilisation windows, idle slot identification, and trailer staging patterns. Inputs directly to slot booking optimisation and yard management systems.

Yard utilisation · Today
06:0082% Peak
09:0097% Near full
12:0061%
15:0079%
18:0051%
03

Aisle congestion & flow

Real-time detection of aisle congestion and counter-flow events inside the warehouse. Alerts route to the operations centre before a bottleneck affects pick rates or safety compliance.

Congestion alert · 14:22
ZoneAisle C3
EventCongestion detected
CauseForklift counter-flow
Waiting4 units queued
ActionOps centre notified
04

SLA monitoring & reporting

On-time departure rate, dwell-time SLA breach tracking, and weekly performance summaries by carrier, dock, and shift. Reports that feed into carrier performance reviews and operational KPIs — automatically generated from camera intelligence.

Weekly SLA report
On-time departure94.2%
SLA breaches12 this week
Avg breach duration18 min
Worst dockDock 3
Worst shiftNight A

No new sensors. No infrastructure project.

Logistics facilities run extensive CCTV for perimeter security, safety compliance, and insurance requirements. Canopy's edge appliance connects to that existing infrastructure. There is no new sensor installation and no disruption to operations during setup.

Compatible with any CCTV system

ONVIF-compliant connection to your existing NVR, DVR, or IP camera network. Installed by Canopy, typically in under a day for a single facility.

Integrates with yard management and WMS

REST API and webhook delivery for dock events and yard occupancy data. Connects directly to Körber, Manhattan, SAP EWM, and custom WMS platforms.

Carrier-level reporting from day one

Dock dwell and SLA performance broken down by carrier automatically, from the first connected day. No manual data entry required.

Bring your facility layout. We'll show you what Canopy surfaces within the first hour.

A technical walkthrough using your actual dock and yard configuration — live, not modelled.

Book a logistics demo